If you’ve searched for FintechZoom.com Nasdaq, you’re likely trying to do one of three things: check where the Nasdaq Composite stands right now, understand a chart or technical signal you’ve seen, or figure out whether this page is actually useful for tracking the market versus just another data aggregator. This article answers all three.
FintechZoom’s Nasdaq coverage pulls together market charts, performance data, technical indicators, and related financial news into a single page built around the Nasdaq Composite (ticker COMP; commonly shown in market data as ^IXIC / .IXIC). That consolidation is genuinely useful for monitoring the market. But the value of that page depends entirely on knowing what the underlying index actually measures, what its data can tell you, and what it cannot.
What Does FintechZoom.com Nasdaq Mean?
FintechZoom.com Nasdaq generally refers to FintechZoom’s coverage and market-tracking tools for the Nasdaq market, particularly the Nasdaq Composite Index.
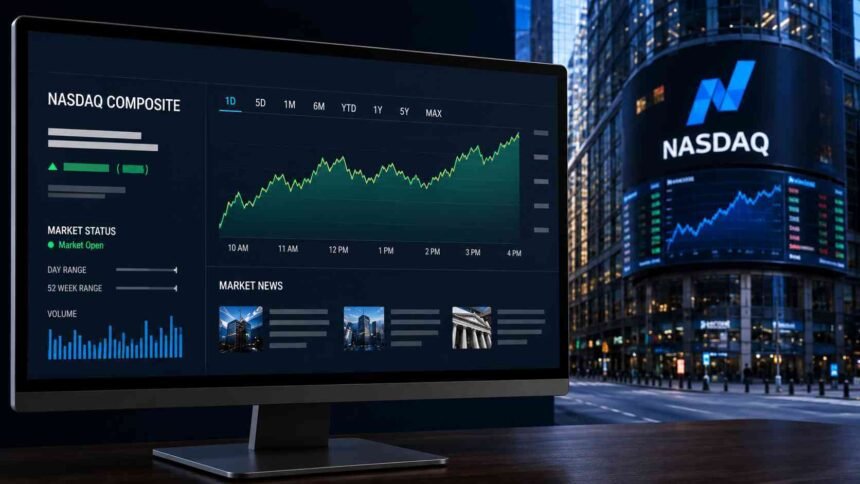
FintechZoom’s dedicated Nasdaq page uses .IXIC in its market-data presentation and provides information on the index through its performance, charts, technicals, and news coverage. The page is designed to give readers a central place to monitor movements in the index and follow developments involving Nasdaq-listed companies.
There is an important distinction, however.
FintechZoom is not Nasdaq.
Nasdaq is a major financial-market company and the operator of the Nasdaq Stock Market. FintechZoom is a financial information and media platform that provides coverage and tools related to markets, including Nasdaq. That distinction matters because a financial website can display or analyze market information without being the exchange that operates the marketplace.
What Is the Nasdaq Composite?
The Nasdaq Composite is one of the major U.S. stock market indexes. Rather than tracking only a small group of large technology companies, it covers a broad range of common-type stocks listed on the Nasdaq Stock Market.
Nasdaq’s own index documentation describes the Composite as a broad benchmark containing thousands of Nasdaq-listed securities. Its market-capitalization weighting means that companies with larger market values have greater influence over the index’s movement. As a result, the headline index return can be influenced disproportionately by its larger constituents and may not reflect the performance of the average Nasdaq-listed company.
That is why the Nasdaq Composite is frequently associated with technology and growth stocks, even though it is not simply a technology index. The exchange has listings across multiple industries, so the Composite provides a broader view of the Nasdaq-listed market than an index focused exclusively on a single sector.
Nasdaq Composite vs. Nasdaq-100
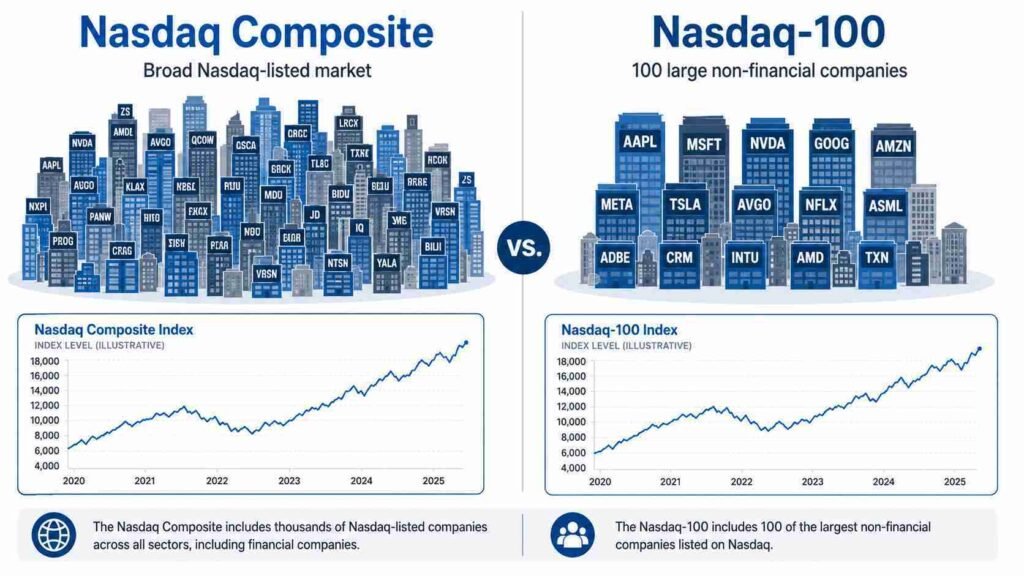
One of the easiest ways to misread Nasdaq market coverage is to assume the Nasdaq Composite and Nasdaq-100 are interchangeable. They are not, and mixing them up is one of the most common mistakes readers make when following index headlines.
| Feature | Nasdaq Composite | Nasdaq-100 |
|---|---|---|
| Main purpose | Broad measure of Nasdaq-listed stocks | Large-cap benchmark |
| Number of companies | Thousands | 100 companies |
| Financial companies | Included where eligible | Excluded |
| Weighting | Market capitalization based | Modified market capitalization |
| Typical exposure | Broad Nasdaq market | Large non-financial Nasdaq companies |
| Symbol | COMP (Nasdaq official); commonly shown in market data as ^IXIC / .IXIC | NDX |
The Nasdaq-100 tracks 100 of the largest non-financial companies listed on Nasdaq, spanning areas such as technology, consumer businesses, healthcare, telecommunications, biotechnology, transportation, media, and services. It uses a modified market-capitalization methodology rather than giving every constituent equal weight.
This difference matters when reading financial coverage because the two indexes represent different segments of the Nasdaq-listed market. A headline saying “Nasdaq rose” may refer to the Composite, while an investor’s ETF may actually track the Nasdaq-100. The two can move differently because they hold different securities and use different methodologies, so the same market event can produce different index returns.
What Can You Find on FintechZoom’s Nasdaq Coverage?
FintechZoom’s Nasdaq page is built around four core data types: performance figures, price charts, technical indicators, and related news. Each one answers a different question, and reading them together rather than in isolation is what makes the page useful.
Performance Data
Performance data tells you how the index has moved across different timeframes, and the timeframe you choose changes the story entirely. A one-day gain and a one-year gain answer completely different questions, so treat the daily number as a snapshot, not a verdict.
Useful periods typically include:
- One-day performance
- One-month performance
- Three-month performance
- Year-to-date performance
- One-year performance
- Longer historical periods
A short-term trader will care most about daily and weekly moves. A long-term investor should weight historical performance more heavily and treat single-day swings as noise. Comparing timeframes side by side is the fastest way to tell whether a move is a blip or the start of a trend.
Price Charts
A chart turns raw numbers into something you can actually read at a glance. You can see whether the index is trending up or down, how sharp the move has been, and whether a given period was unusually volatile relative to its recent history.
What a chart won’t do is predict the next move. Past price patterns don’t guarantee future direction, and two people looking at the same chart can walk away with opposite conclusions. Use charts to understand what happened, not to forecast what happens next.
Technical Indicators
Alongside the chart, FintechZoom’s Nasdaq coverage presents technical indicators that measure momentum, trend strength, trading volume, and other characteristics of price behavior.
If you’re new to technical analysis, the key point is simple: indicators describe past and current price behavior, not what comes next. A moving average smooths out short-term noise, while other indicators attempt to flag momentum shifts or unusually active trading periods. How useful any single indicator is depends heavily on the timeframe you’re applying it to, so don’t lean on one signal in isolation.
Why the Nasdaq Matters to Investors
The Nasdaq draws outsized attention because of the concentration of innovative, growth-oriented businesses listed on it, but reducing it to “the tech index” misses what actually moves it day to day.
Large technology companies have historically anchored Nasdaq’s identity, but the market spans healthcare, consumer businesses, communications, biotechnology, and more. That breadth means Nasdaq performance reflects several forces layered on top of each other, not a single narrative.
Interest rates are one of the biggest. Growth companies are especially sensitive to the cost of capital because more of their expected value sits in future earnings, which get discounted more heavily when rates rise. Corporate earnings are the other major lever: when large constituents beat or miss expectations, their stock moves ripple through the index disproportionately. The market’s reaction depends less on whether earnings were “good” in absolute terms and more on how they compared with what was already priced in.
Other influences worth tracking include:Why the Nasdaq Matters to Investors
- Economic growth expectations
- Inflation
- Interest-rate expectations
- Corporate earnings
- Artificial intelligence investment
- Semiconductor demand
- Consumer spending
- Currency movements
- Geopolitical developments
- Shifts in investor risk appetite
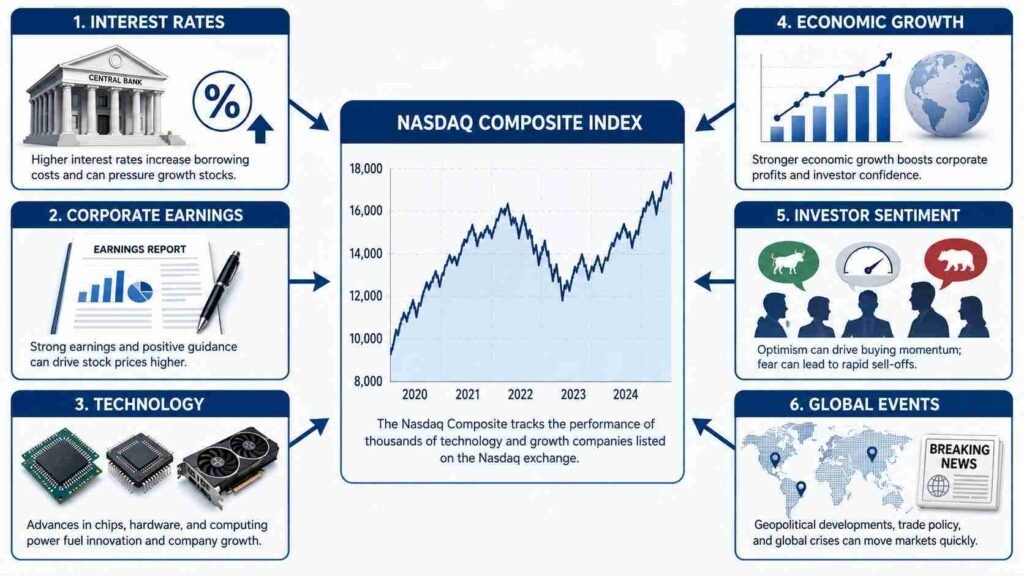
These forces don’t always pull in the same direction. Strong economic growth, for instance, can lift earnings expectations while simultaneously pushing interest-rate expectations higher. That creates a mixed signal that can send the index either way depending on which force dominates. That’s why watching the index number alone tells you that something happened, but not why.
How to Read Nasdaq Data More Carefully
A common mistake is to focus on the headline number without asking what’s behind it.
If the Nasdaq Composite rises on a given day, that doesn’t mean every Nasdaq-listed company gained. A market-cap-weighted index can be driven meaningfully higher by a handful of large constituents even while the median stock in the index is flat or down. This is why a strong index return doesn’t automatically mean gains were spread evenly. It’s worth checking market breadth, not just the headline percentage.
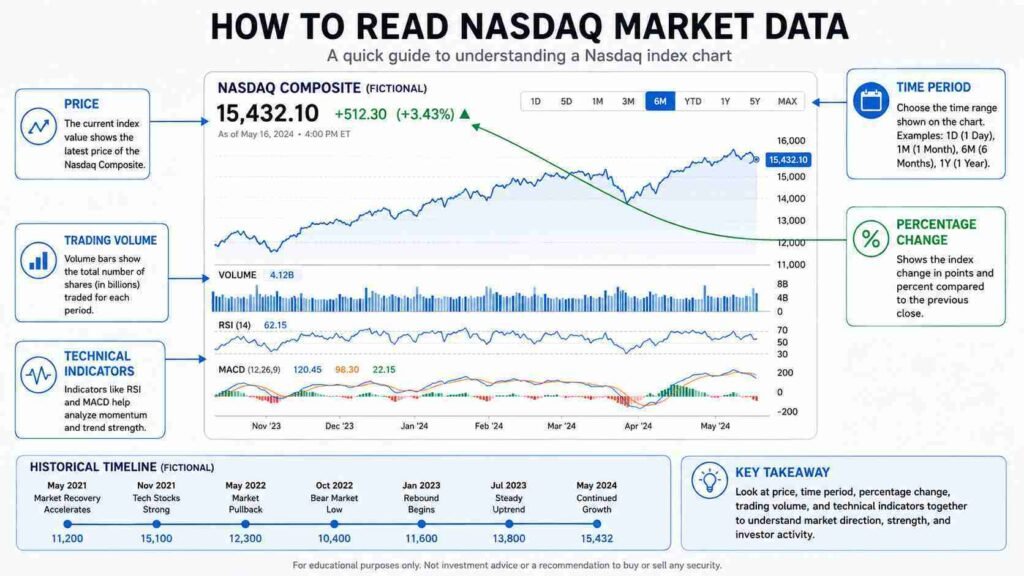
When reviewing Nasdaq market data and charts, look beyond the percentage change:
Which index is being displayed? Check whether the data refers to the Nasdaq Composite, Nasdaq-100, or another Nasdaq index.
What timeframe is being measured? A one-day gain and a one-year gain answer very different questions.
Which companies are driving the move? Large constituents can have a disproportionate effect on an index.
What news explains the movement? Earnings, economic reports, interest-rate expectations, and company announcements can all influence prices.
Is the move unusually volatile? A large percentage change may signal the market reacting to new information rather than establishing a lasting trend.When reviewing Nasdaq information, look beyond the percentage change:
This approach gives you a far more useful picture than simply checking whether the index is green or red.
FintechZoom Nasdaq Can Be Useful for Market Monitoring
The real advantage of a page like this is time saved, not information you couldn’t find elsewhere. Instead of pulling an index chart from one source, technical data from another, and news from a third, FintechZoom consolidates:
- Index performance
- Historical charts
- Technical information
- Market news
- Listed-company coverage
into one place. For someone tracking the Nasdaq regularly, that consolidation removes friction from the research process. You’re not toggling between five tabs to get a full picture.
It’s also useful for context, not just convenience. When a single company is driving a meaningful chunk of the index’s move, checking that company’s coverage alongside the broader index data helps explain the headline number instead of leaving you guessing at it.
Just don’t mistake convenience for completeness. A well-organized dashboard makes information easier to find; it doesn’t make the underlying market any more predictable.
Why Nasdaq Data Should Not Be Used in Isolation
No chart, dashboard, or financial website, including FintechZoom, eliminates investment risk. Stock prices move on new information, shifting expectations, and sentiment, and that volatility is a permanent feature of markets, not a flaw in the data.
The more practical distinction is between market information and investment research. A chart showing that a stock rose tells you nothing about whether its valuation is reasonable. A technical indicator flagging stronger momentum says nothing about whether the underlying company’s earnings will hold up next quarter. Treating a rising chart as a buy signal, or a technical pattern as a guarantee, is where most avoidable mistakes happen.
Before acting on Nasdaq data, it’s worth cross-checking it against financial statements, company filings, earnings reports, valuation measures, and how a position fits your own objectives. Don’t rely only on whether the line on the chart is moving up.
What About Investing in the Nasdaq?
Investors cannot simply purchase the Nasdaq Composite or Nasdaq-100 as if either were an individual company share. Instead, financial products such as exchange-traded funds and other investment vehicles are designed to track particular indexes.
Nasdaq explains that the Nasdaq-100 itself is an index rather than an investment product. Products designed to track it can differ in fees, tracking performance, concentration, and market behavior, so two funds tracking the “same” index can still deliver noticeably different results to an investor.
That distinction matters because buying an index-tracking product isn’t identical to owning every company in the index directly. The structure and cost of the product, and how closely it tracks its benchmark, directly affect what you actually experience as an investor.
Nasdaq and Portfolio Diversification
Nasdaq exposure gives you access to many large, growth-oriented companies, but heavy exposure to one market doesn’t equal diversification, and it’s worth being specific about why.
Because the Composite is market-cap-weighted and skews toward large technology and growth names, a portfolio built primarily around Nasdaq-tracking products can end up more concentrated in a handful of sectors and mega-cap stocks than an investor might expect from a “broad market” label. That concentration risk is worth checking explicitly, not assuming away.
Diversification across sectors, market caps, and geographies can reduce the risk of any single concentration dragging down a portfolio, though it can’t eliminate market risk entirely. Before adding or increasing Nasdaq-related exposure, it’s worth checking how much overlap already exists with other holdings, rather than treating the index as a standalone decision.
Is FintechZoom.com Nasdaq a Trading Platform?
No. FintechZoom’s Nasdaq page is a source of market information, charts, analysis, and financial coverage. It is not a brokerage.
Tracking market data and executing trades are two separate functions. A market-data page helps you monitor an index or research a company; actual buy and sell orders go through a brokerage or other licensed financial intermediary. This distinction matters most for newer investors, who may see a live quote and assume they’re looking at a trading account rather than a reference tool.
How to Use FintechZoom Nasdaq More Effectively
The most useful approach is to treat the platform as one part of a broader research process, not the final word.
Start with the index you actually want to follow. If you’re interested in the broad Nasdaq-listed market, the Composite is the more relevant benchmark. If you’re specifically tracking the large non-financial companies in the Nasdaq-100, use NDX instead.
Then work through the data in context:
First, identify the index and timeframe. Determine which benchmark is being displayed and whether the data represents a daily move, a longer-term period, or a historical comparison.
Next, examine what is driving the move. Look at major constituents, company earnings, economic data, monetary-policy developments, and other news that may explain the change.
Then, review the broader context. Consider whether the movement reflects a wider market trend or a reaction to a specific event.
After that, examine individual companies if relevant. An index movement may be driven by a relatively small number of large constituents.
Finally, verify important information. For decisions involving real money, use primary company filings, official index information, and other reliable sources rather than relying on a single commentary page.
This process turns a market dashboard into a research starting point rather than a source of automatic investment decisions.
Final Takeaway
FintechZoom.com Nasdaq is a consolidation tool, not a research substitute. It’s genuinely useful for pulling Nasdaq Composite performance, charts, technicals, and news into one place, and that convenience is worth something if you check this kind of data regularly.
But convenience isn’t the same as insight. The Nasdaq Composite is a broad, market-cap-weighted index of thousands of Nasdaq-listed stocks, while the Nasdaq-100 is a narrower benchmark of 100 large non-financial companies. Mixing the two up, or reading a headline percentage without asking what’s driving it, is the single most common way readers misread Nasdaq coverage.
Use FintechZoom’s page to see what happened and to organize your research. Use primary filings, earnings reports, and your own portfolio context to decide what to do about it. The dashboard can make monitoring easier; it can’t make the decision for you.
This article is for general informational and educational purposes only and does not constitute financial, investment, tax, or legal advice. Investing involves risk, including the possible loss of principal. Readers should conduct their own research and consider consulting a qualified financial professional before making investment decisions.